How to Check CPU Usage on a Mac — Why % CPU Goes Over 100% in Activity Monitor
Published November 12, 2026
Official documentation reviewed November 12, 2026 (some steps not tested)
By Wada Digital Lab
You check CPU usage on a Mac in the CPU tab of Activity Monitor. Click the % CPU column heading, and when the arrow in the heading points down, the processes using the most CPU are at the top. The bottom of the window shows System, User, and Idle for the whole Mac. % CPU can go over 100% because it counts one CPU core (a part that does the calculating) as 100%. On our MacBook Air (M4, 10 cores), one test program showed 252.3%. For the whole Mac, that is about 25%.
Key points
- Check CPU usage in Activity Monitor (Applications > Utilities in the Finder), in the CPU tab at the top.
- To see which app is using it, click the % CPU heading and sort from largest to smallest.
- To see how much the whole Mac is using, look at System, User, and Idle at the bottom of the window. The three add up to 100%.
- % CPU counts one core as 100%. On a Mac with 10 cores, one process can show up to nearly 1000%. A number over 100% does not mean something is broken.
- To keep an eye on it, use the small CPU Usage window or the Dock icon. Our free app Memory Watch (we make it) shows each app’s share with the whole Mac as 100%.
The diagram below shows the difference between the two ways of counting.
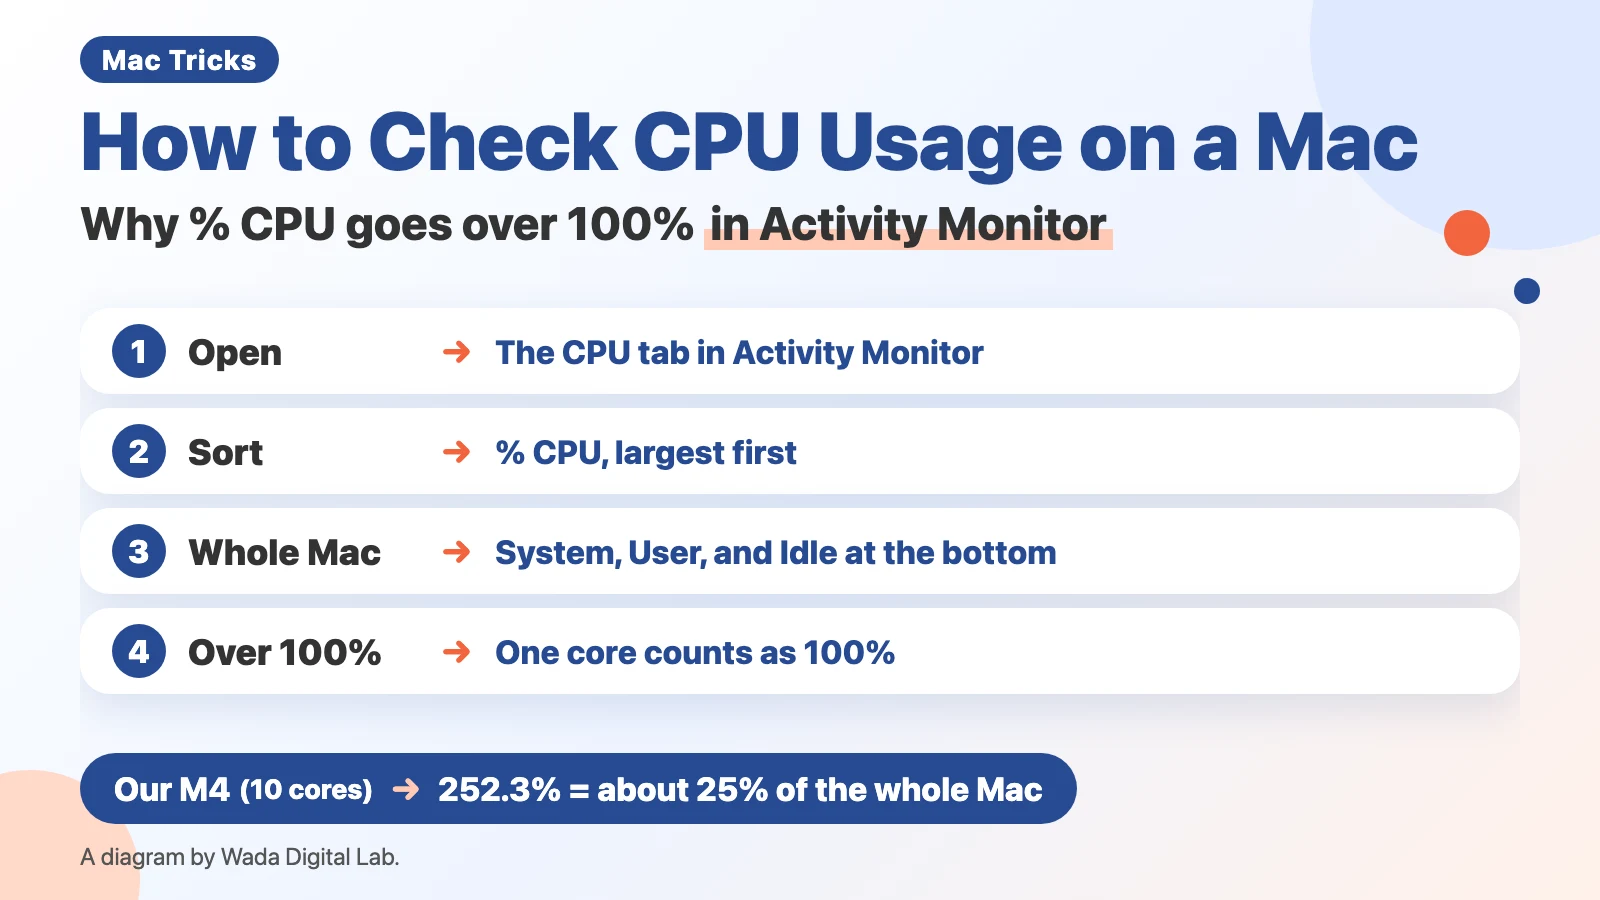
What CPU usage means: how hard the part that does the calculating is working
CPU usage is the share of time the CPU, the part of the Mac that does the calculating, is busy. Apple’s “View CPU activity in Activity Monitor on Mac” says:
“Most of the time, the processor on your Mac uses only a small percentage of its processing power. When you use apps that require intensive calculation, the processor uses more of its capacity.”
Exporting video or a browser with many tabs open uses a lot of CPU. When usage stays high, the Mac can feel slow and get warm. For heat, see our article on a hot MacBook Air and our article on a loud fan.
How to check CPU usage: open the CPU tab in Activity Monitor
You check CPU usage with Activity Monitor, which comes with every Mac. There are 4 steps.
- In the Finder, open Applications > Utilities and double-click Activity Monitor (or type “Activity Monitor” in Spotlight; we didn’t test either way of opening it on the recording Mac)
- Click CPU at the top of the window
- Click the % CPU column heading, and check that the arrow in the heading points down (largest first)
- Look at the app names at the top and their % CPU numbers
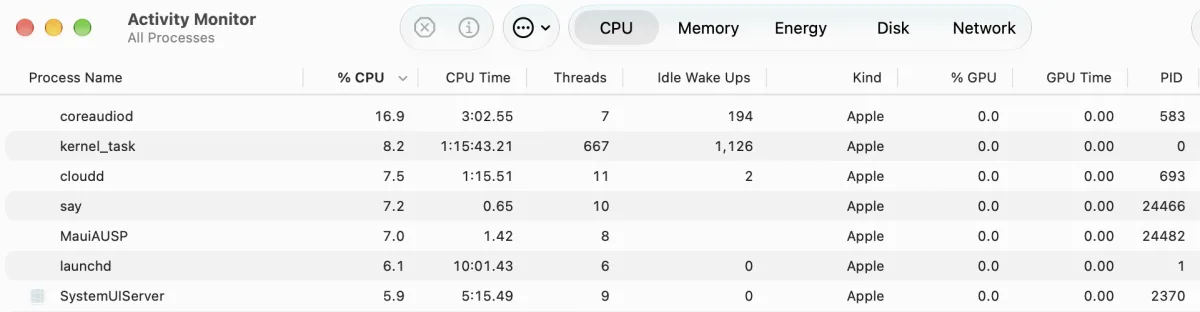
The bottom of the window shows the whole Mac. In Apple’s words, System is the share used by processes that belong to macOS, User is the share used by apps you opened (or by the processes those apps opened), and Idle is the share not being used. The three add up to 100%. On the right are the CPU Load graph and the number of Threads and Processes. Apple describes a process as a program running on your Mac. In our own words, a thread is a piece of work that runs at the same time as others inside one process.
You may also see unfamiliar names at the top, such as kernel_task or mds_stores. For kernel_task, see What is kernel_task on a Mac.
Why % CPU goes over 100%: one core counts as 100%
% CPU in Activity Monitor counts one CPU core as 100%. A core is a part inside the CPU that does the calculating, and the number depends on the Mac model. The two Macs we checked had 8 and 10. If one app keeps 2 cores busy, it shows 200%. Going over 100% does not mean anything is broken.
We tried this on our MacBook Air (M4, 10 cores, macOS 27.0.1) on November 12, 2026. We ran a small test program that keeps 3 pieces of work going at once for 12 seconds, and read the number with top in Terminal (top counts the same way as Activity Monitor: one core is 100%).
- % CPU of the test program: 252.3% (about 2.5 cores)
- Against the whole Mac (10 cores = 1000%): about 25%
We expected close to 300% for 3 pieces of work, but we measured 252.3% (we didn’t check why it fell short of 300%). The limit for the whole Mac is the number of cores × 100%. With 10 cores, the % CPU of every app added together can reach about 1000%.
The diagram below shows the same process counted both ways.
% CPU in Activity Monitor
What 100% means One core
Our test program
252.3%
Divide by 10 cores
With the whole Mac as 100%
What 100% means The whole Mac (10 cores)
Our test program
About 25%
We also ran a heavy job on purpose on the Mac we use for screenshots (MacBook Air (M2), 8 cores).


Check how many cores your Mac has
The number of cores is shown as Total Number of Cores under Hardware in System Information (Apple menu > About This Mac > More Info… > System Report…). On our MacBook Air (M4), system_profiler SPHardwareDataType in Terminal showed 10: 4 performance cores and 6 efficiency cores.
Here is what each place tells you.
| Where to look | What it tells you | How it counts |
|---|---|---|
| % CPU in the list | Which app (process) is using the CPU | One core is 100%. Can go over 100% |
| System, User, Idle at the bottom | How much the whole Mac is using | The three add up to 100% |
| Window > CPU Usage | Each core, right now | One bar per core |
| Window > CPU History | Each core, over the last little while | One graph per core |
To keep an eye on it: the small CPU Usage window and the Dock icon
To watch CPU usage while you work, use the Window menu in Activity Monitor. Following Apple’s “View CPU activity in Activity Monitor on Mac,” you can do three things.
“To view current processor activity, choose Window > CPU Usage.”
- Right now: Window > CPU Usage shows each core’s usage in a small window
- The last little while: Window > CPU History shows a graph for each core
- In the Dock icon: choose View > Dock Icon, then Show CPU Usage or Show CPU History (Apple’s page calls it the Show CPU option; we checked the item names in the text inside macOS)
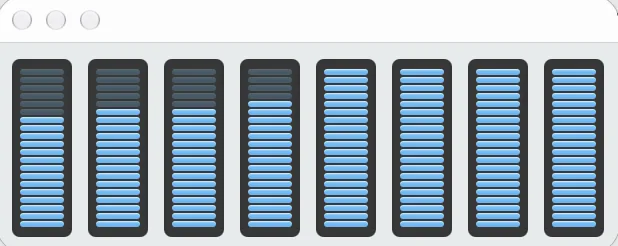
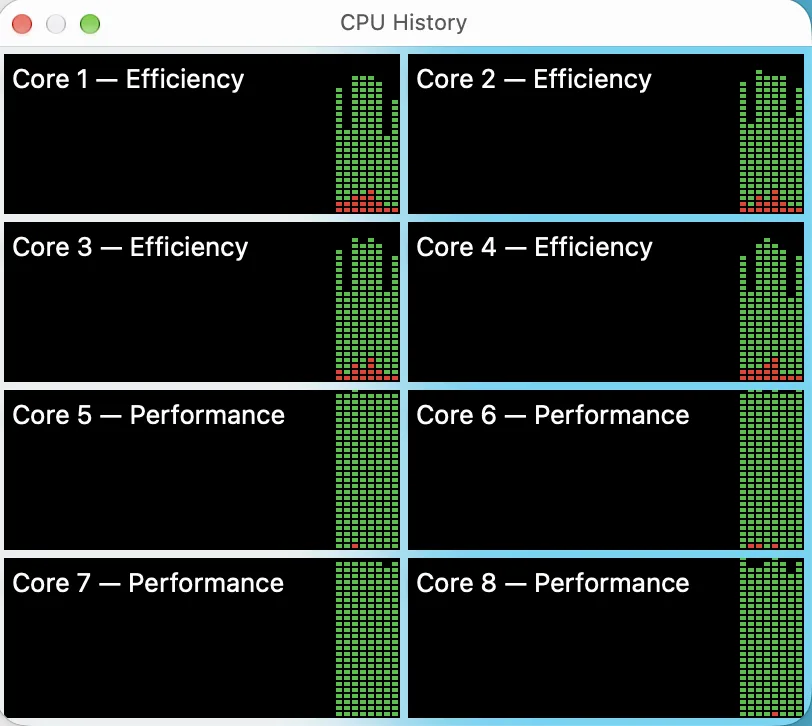
To show it in the Dock icon, keep Activity Monitor open.
Check it in Terminal: the top command
In Terminal, type “top -o cpu” and press Return to list processes with the highest CPU first. The numbers update every second (the default interval in the top manual, man top; we didn’t test this command’s screen). Press Q to quit. It counts the same way as Activity Monitor: one core is 100%.
An easier way: each app’s share with the whole Mac as 100% (Memory Watch)
% CPU in Activity Monitor is hard to read unless you know your core count. 252.3% could be a quarter of the Mac or half of it, depending on how many cores there are.
We (Wada Digital Lab) make a free Mac app that watches your Mac, called Memory Watch. Version 1.2.0 adds a CPU by App table to its Mac Status window. The numbers are a share of the whole Mac (100%), counted the same way as CPU Use at the top of the window, so no app goes over 100%. Each number is the average over about the last 10 seconds, and processes from the same app are added together.
We built this table because we wanted to see which app was using the CPU when a Mac stayed slow for a long time. Once it worked, Memory Watch itself sometimes showed up second or third in the table. A watcher that slows the Mac down is no good, so we changed it to measure every 10 seconds instead of every 5 and cut its own CPU use to about a third.
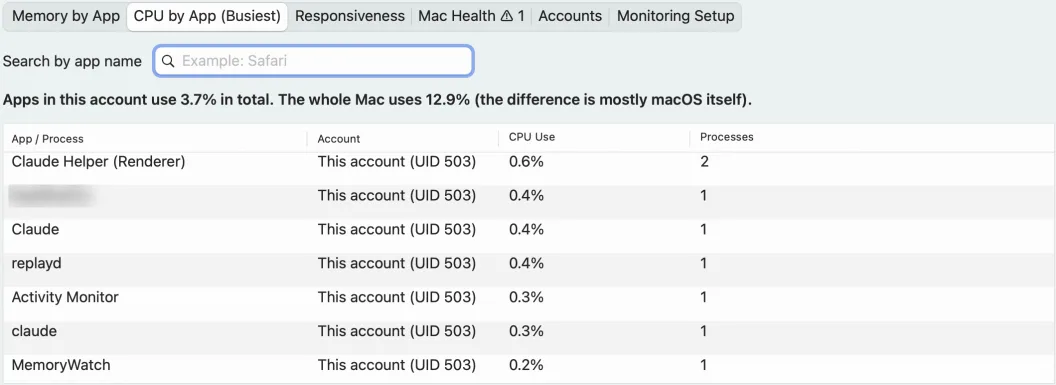
The table only shows apps running in your own account. macOS processes such as WindowServer (which draws the screen) can’t be read by Memory Watch, so they don’t appear. You can see that share in the whole-Mac number above the table. Memory Watch doesn’t quit apps or free up CPU. The color and stars of its menu bar icon show memory headroom. There is no sign-up, no ads, and no in-app purchase. It works on a Mac with a chip made by Apple (such as M1 or M4) and macOS 14 Sonoma or a newer macOS. It does not work on Intel-based Macs or on macOS 13 or older.
Frequently asked questions
What CPU usage is normal?
Apple doesn’t give a number. In Apple’s words, the processor usually uses “only a small percentage of its processing power.” If Idle at the bottom stays low while you aren’t doing anything heavy, check the apps at the top of % CPU.
An app shows 300% CPU. Is something wrong?
No. % CPU counts one core as 100%, so an app using 3 cores shows 300%. On a Mac with 10 cores, that is about 30% of the whole Mac.
How do I lower CPU usage?
Quit apps near the top of % CPU that you aren’t using. You can also select one in Activity Monitor and click the Stop button (the X at the top left), then Quit. For more, including kernel_task, see What is kernel_task on a Mac — why CPU usage is high and how to lower it.
Should I look at memory or CPU?
When your Mac is slow, look at both. Check memory with the color of Memory Pressure in the Memory tab, and CPU with % CPU in the CPU tab. For memory, see Mac running slow? How to check Memory Pressure.
What we checked, and Apple’s pages
We took the screenshots on November 12, 2026, in a separate user account we made for screenshots (MacBook Air (M2), 8 cores, 16 GB of memory, macOS 27.2, Activity Monitor 10.14, English). On that screen we chose CPU, sorted by % CPU, and opened Window > CPU Usage and Window > CPU History. For the screenshot over 100%, we ran a video encode (ffmpeg) on purpose and stopped it afterward. We didn’t try opening Activity Monitor from Utilities in the Finder, the Dock icon setting, top -o cpu in Terminal, or Total Number of Cores in System Information (the core count on our MacBook Air (M4) is from system_profiler). The Memory Watch screenshot was taken on the same Mac with Memory Watch 1.2.1 (build 63).
We measured % CPU over 100% and the core count on our own Mac.
- Model: MacBook Air (M4, 10 cores, 16GB of memory)
- macOS: macOS 27.0.1
- Measured on: November 12, 2026 (a 12-second test program, read with top)
Before writing, we searched Google in the US for “mac cpu usage over 100” and read the top results (November 12, 2026): forum threads asking why a process was over 100%, and a blog post from a company that sells a monitoring app. This article puts Apple’s own words first, and adds what we measured: 252.3%, and about 25% of the whole Mac.
Sources (Activity Monitor User Guide):